I’m in the possession of a couple of CKM sensors so now it is time to run a number of experiments and also generally see what a CKM can teach me and how useful it is to have one on your arm.
This article is a first by which I want to introduce more about my physiology so that it can help you interpret the results. Being an n=1 this is very important.
See the next ones:
I’ll have the following experiments in mind:
- Cold water immersion
- Caffeine versus Decaffeine
- High Protein
- Alcohol
- Milk
- Exercise
But also see if I can find any insights from a possible correlation with sleep and with heart rate. One of my suspicions is that night time heart rate may correlate with ketosis resulting in a lower HRV.
About my SiBio collaboration
SiBio made contact to promote their new CKM on the market. I have accepted this under the condition that there is no restriction, no redaction on what I write about it. To be clear, they never even hinted at wanting to do such a thing.
I gladly accepted as I have quite a number of theories on my blog and this gives me a chance to strengthen support for some of them. Or try to disprove the theories as scientists call it.
In return for providing me with this opportunity, I do think it is only fair to highlight to you the positive side of using a CKM but I want to be transparent about it from the start.
Even before SiBio, I was already anticipating using a CKM one day for understanding my personal ketone levels and what affects them as I saw papers passing by studying these solutions.
Body Profile
Why share my profile? Because the data that is presented will be applicable to me. It is relevant to my physiology, my metabolism, my genetics. Ketones are sensitive to metabolism so it is good to understand the results relative to my metabolic profile.
I’m a lean individual. According to my foot impedance scale I’m at around 10% body fat. This is probably lower because on keto you may have a higher fat content in the leg muscles and fluid retention is lower but I’m missing a DEXA scanner to truly confirm this for myself.
- Height: 1m90cm
- Weight: +/- 72kg
- BMI: 19.94 kg/m²
- Age: 47
- Sex: Male
- On keto: 7 years
Before keto, you could call me TOFI which says something about my lack of capacity to grow. I’ve never been able to put on much muscle which shows that I have likely very little type II muscle fiber so predominantly type I or other problems that prevent a normal growth response. This could also be linked to a fairly low metabolism resulting in a lower lipolysis rate versus other more average people or more extreme muscle building responders to exercise.
Over the years I’ve been searching for different methods in resistance exercise and although I’ve managed to gain weight, it goes off to baseline as well. From around 76kg, jumping on the keto diet I lost weight and bottomed at 67kg. Then I trained hard during winters and it took several years where I finally managed to get up to 78kg in December 2020. But that was probably at least in part due to fluid retention from the lift-to-failure inflammation. From there I went back to 74kg and hovered around that weight for a while. Next I took out caffeinated coffee and dropped to 71.5kg. So it is actually not easy for me to gain muscle mass.
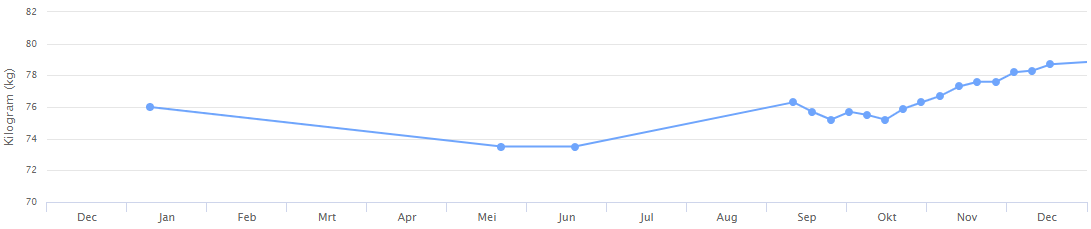
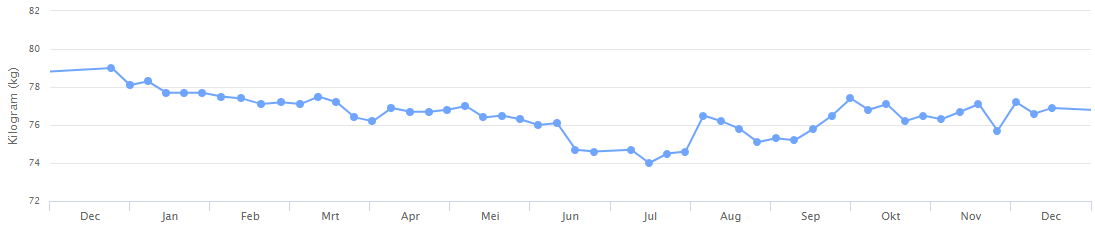
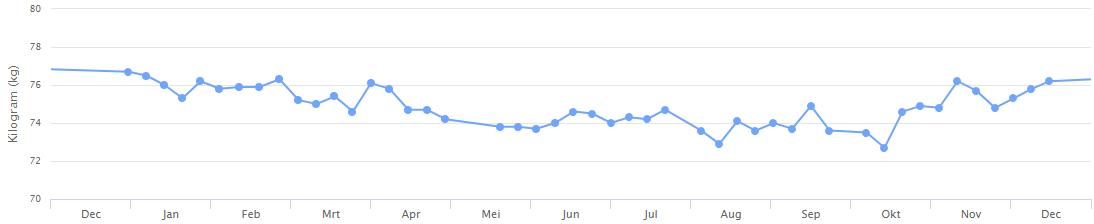
Usually I start resistance training from October onwards and that results in weight gain but as of January I pick up endurance again and this lowers the weight. Below are the weekly averages across the last years.
2020
2021
2022
2023
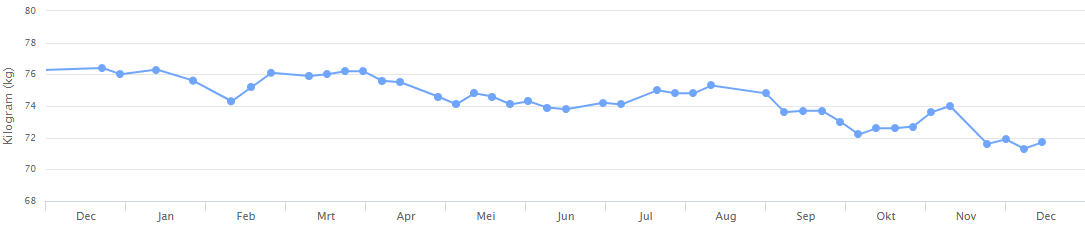
The end of this year is breaking the trend by further reducing weight. This is because I wasn’t able to apply the usual resistance exercise and continued to maintain a relative higher volume of endurance exercise versus previous winters.
In addition, here are my blood glucose measurements across the years. There’s obviously measurement bias because I didn’t always continuously had a fixed interval of measurements. Certainly towards the latter part I started to only measure when I was symptomatic or right after sports, evening vs morning etc.. Despite this randomness in measuring it shows on average a decline.
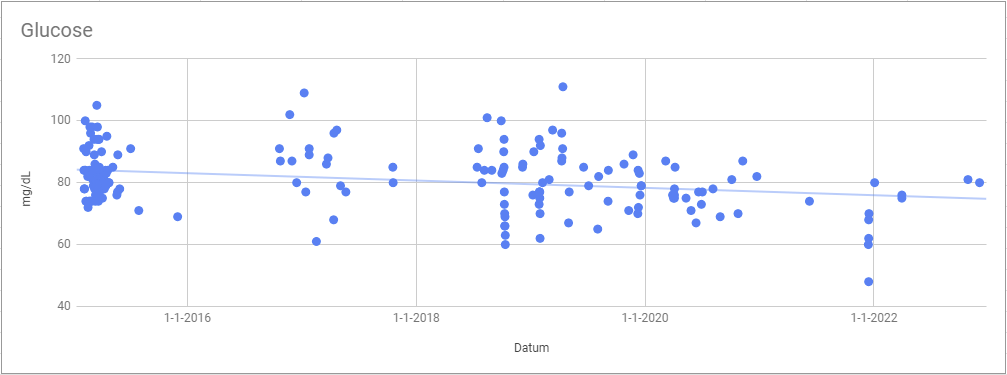
The high concentration of measurements at the start in 2015 were on a high carb diet with symptomatic hypoglycemia when I reached 70mg/dL. Fast forward, end of 2021 I felt the same symptoms but this time reached a low of 48mg/dL
I have only a limited set of blood ketone readings from October 2016, just a month into the ketogenic diet. Usually measured right before or after diner, I averaged 0.56mmol/L and one morning reading before breakfast of 0.4mmol/L
Activity Profile
I will share a bit of insight into my training history. It is good to understand my fitness level. I am not sharing this information for you to judge whether I’m training in the right way, doing things optimally etc.. That is not the purpose. Again, this is being shared to help you understand my physiology in relation to the results.
Since about 2010 I picked up on endurance sports. First I built up capacity with MTB and then added running later on and introduced road cycling into the mix around 2015.
Following a training plan, I managed to run a marathon by myself, no competition, during winter (without drinking or eating!)
https://www.strava.com/activities/457232966
I’m by no means anything noteworthy as an athlete. Perhaps my best performance was at a cycling event in France in 2016 called “Les 3 ballons” where I ended 181th out of around more than 3000 participants. I was 50th in my age category:
https://www.strava.com/activities/605788333
Attesting to my body profile, I observed I have trouble following at the beginning of races because the power starts very high and I don’t have that much power but I’m better at longer races because I have a higher amount of power coming from the type I fiber which fatigue less easily. Together with a low weight this is an advantage in the mountains.
In the last 3 years I have been participating in short intense local races of +/- 50 minutes where my goal was to prevent being doubled 🙂 These are the type of races where muscle power is more important than endurance capacity so that is why I have been trying to gain more muscle in the legs.
In short, I’m a seasoned recreational yet fanatic sportsman keen on running many training experiments and not afraid to fail.
In the graph below you see the weekly volume in hours across the last year which is a mix of running and cycling. There are certainly gaps with very low volume but generally on average at around 11 hours per week
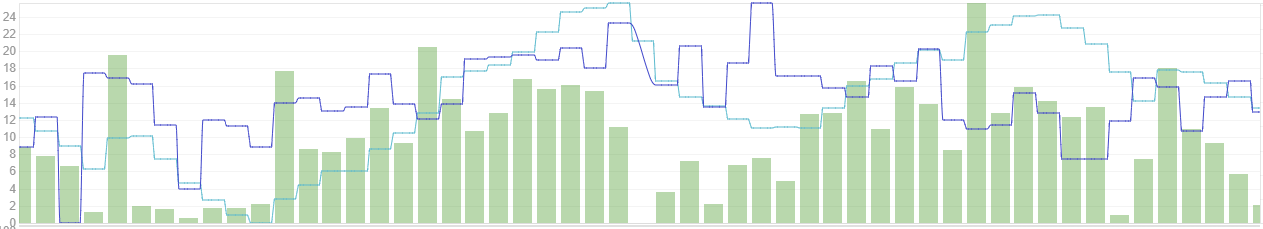
Kudo’s to intervals.icu for the extensive analysis that they make possible.
Setup of the sensor
Applying the sensor to my arm was really easy. The instructions are clear so if you follow them I can’t imagine any issues occurring.
There was a few small issues with pairing the device though.
- The app allows you to scan the QR code on the package but this didn’t do anything
- As a backup you can just enter the code. I tried several times to pair with the sensor but it just didn’t want to work
Finally I decided it may be due to my Bluetooth connection. Some phones may disable Bluetooth to optimize battery when you don’t have any Bluetooth devices connected. Bluetooth devices can also broadcast their presence but I think this is not the case for the sensor. It doesn’t show up in the list of available devices and that is probably also why the ID needs to be entered in the app.
Anyway, I resolved it by rebooting my phone so if you get similar troubles… a reboot can help.
The sensor has to go through a warm up phase of 60 minutes so if you consider testing with it immediately then keep those 60 minutes in mind.
I chose to apply it on my left arm because I’m right handed and working muscle may extract some amount of ketones but I don’t think this will be of any influence since most of the working arm muscles are passed the sensor and it is a measurement in the skin sampling the interstitial fluid, not what is present in the blood.
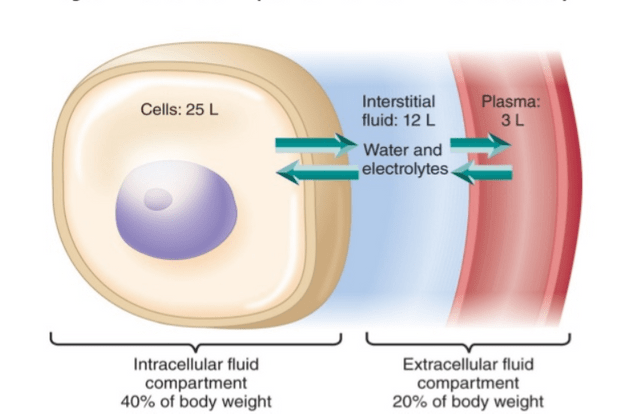
As you can see in the image below, there is a 4x higher volume of interstitial fluid so it is normal to have small discrepancies with blood ketones as it takes a while for the interstitial fluid to adapt to the same concentration as in the blood. Both during increasing and decreasing ketone levels there will be a delay. What is important though is the interstitial fluid measurement because that shows what concentration of beta-hydroxybutyrate cells truly are exposed to.
And here’s a first result.
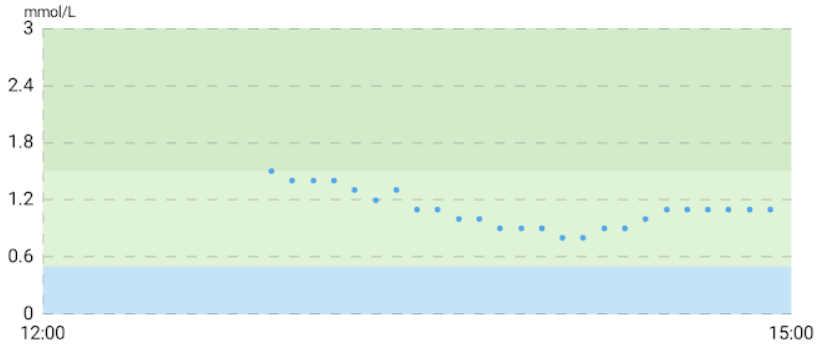
The first measurement was at 12:55pm with 1.5mmol/L and showed a downward trend. I had a high fat (butter +/- 100gr) meal with slices of jamón in the morning immediately followed with a glass of milk and a coffee with a bit of heavy cream and then get to my desk to sit down and work. That was at 08:00am so we’ll see in a next article how high it actually goes.
The milk is pasteurized but straight from the farm so its fat content hasn’t been homogenized.
At 02:00pm I finished 6 eggs mixed with shredded cheese and guessing about 50gr of butter with fresh cut garlic and a small onion and a good amount of salt. It is interesting to see that already 15 minutes later there is an increasing trend but with a plateau for the next 30 minutes. I think here an equilibrium is created between ketone production from the dietary fat and counteraction from insulin increase due to the protein.
It is not shown in the picture above but after the 30 minutes plateau, my ketone levels have risen again currently up to 1.9mmol/L. As a first experiment, I’m happy to see that my meal increases ketones rather than decreases.
Stay tuned for more!
————————————- T H E – E N D ————————————-

Leave a comment