Be sure to look at part 1 and part 2 for some more background and earlier observations.
Ketone levels
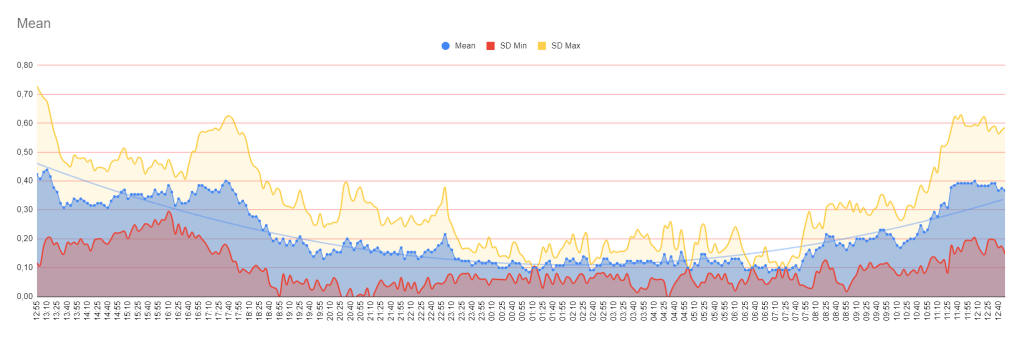
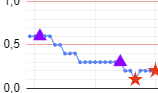
The graph below shows the mean values across these 14 days minus the first day as I was too sick and didn’t find it representative of normal levels. Clearly the sleeping period shows very low ketones, around 0.1mmol/L. As of 19:00 I usually slide onto the couch for tv and that also shows.
But also interesting is that the mean throughout the day seems to center between 0.3 and 0.4 mmol/L. This could be coincidence or this could be the value that my body is striving for. I’ve argued before on this thinking that ketones shouldn’t really be high and consider them rather like glucose where you have an ideal range and can handle the highs and lows just fine. It seems to be supported by Stephen Phinney by lowering his initial ketone target from 0.5 to 0.3 mmol/L but I cannot find a source other than someone commenting on it.
During my sickness I noticed my ketone levels were higher but energy was not well managed.
Note that the red and yellow are lower and upper part of the standard deviation.
It is also a bit funny that the peak, due to getting up and going to bed, is visible at around 23:00.
Blood flow
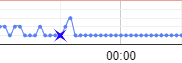
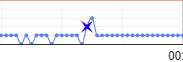
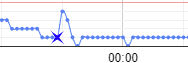
As I explained in part 2, just the fact of having an increase in heart rate pushing your blood around faster will have an affect on the readings. This is demonstrated nicely during the evenings. I’m on the couch watching tv and at some point I get up to go to bed and lay down again. This creates a small bump in ketones.

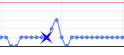
Let me try and explain what I think is happening. This is where the section “Buffers” from part 2 comes in handy.
The blood (or interstitial fluid) has a certain concentration X mmol/L. If you increase the speed of the fluid, the sensor will pick up more ketones per unit of time.
The same goes for the liver which needs to produce the ketones. An increase in speed of the same concentration allows it to produce more ketones per unit of time.
That is initially. But if lipolysis doesn’t pick up then that concentration of fatty acids will go down and therefor also ketogenesis.
The consumption however may be concentration dependent so the initial increase will also lead to a greater uptake. About 10 minutes later we see the total effect by a drop in ketone concentration with sometimes even a little drop below baseline. Simply because lipolysis isn’t increased.
Caffeine
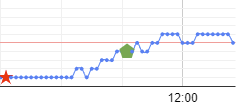
I had a normal coffee at 08:55 and at 10:30 and you see how fast the second cup stimulates the increase in ketones. This is problematic because I usually don’t see this after 1 cup. It makes me think that the level of cortisol released is on the low end with one cup and this is bad.

Caffeine can be fattening. It works unfavorably for me as I think there’s a lasting effect of raised cortisol that actually causes storage of fat instead of release. Either that or 1 cup with enough spread in between towards a second one never raises cortisol high enough but causes an increase that is high enough to stimulate the MR receptor.
High dosage of cortisol will activate the glucocorticoid receptor (GR) and override the actions of the mineralocorticoid receptor (MR). Low levels of cortisol will primarily activate MR which drives fat uptake in adipocytes.
Thus, low-dose chronic treatment may preferentially activate the prolipogenic actions of adipose MR, whereas high-dose acute treatment is needed to activate GR-mediated lipolysis.
source: https://journals.physiology.org/doi/full/10.1152/ajpendo.00478.2015
Not good when you have taken in a high fat content.
Hunger
I’ve written down the time point each time I felt a mild hunger coming up. Initially thinking the ketones would be down, they were actually up!
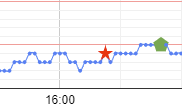
It appears that cortisol may once again explain what is happening. We’ve already seen that it can increase ketones but it can also stimulate hunger. Why is there no hunger after the coffee? When cortisol is produced without exogenous stimulation then, in these instances, it is in response to dropping energy levels (glucose, fatty acids). So I’d guess the hunger is not directly related to the level of cortisol itself although it might be depending on the concentration reached.
Exercise
A firm walking pace and running lowers ketones.

Is it simply lipolysis not keeping pace with consumption?
Volek’s research shows how fast glycerol increases when initiating exercise (see Fig 4). There’s a bit of confounding as the subjects consumed an energy drink 90 minutes before exercise. This explains why they have raised insulin at the start (see Fig 5 in the link below).
https://www.metabolismjournal.com/article/S0026-0495(15)00334-0/fulltext
What we can see from this study is that ketones are not yet above baseline after 1 hour of exercise. I will also have to do multi hour exercises to see what effect I’ll get.
People will argue greater uptake by exercising muscle but that is only a partial explanation. Blood flow from the liver to the rest of the body is distributed evenly so what you can measure in your arm is the same concentration as what goes to the brain and legs. However, what returns in venous blood may be zero ketones from the legs while the rest may still have some. If ketone production doesn’t go up then some dilution will happen.
I suspect that there is a balance maintained based on liver glycogen content. If insulin would drop too fast, there would be too much liver glycogen released so instead we see a more gradual change. As the liver is less capable of releasing glucose, insulin will lower to make it easier for the liver glucose output. At the same time, this will increase lipolysis, allowing more fat to be utilized as we’re running out of liver glycogen.
So my guess is that at the beginning of exercise, there may still be sufficient liver glycogen to support the exercise level so that lipolysis only slowly picks up and therefore there’s also no increase in ketogenesis or at least, the production doesn’t keep track with consumption. Ketones and glucose are utilized and only when the level of glucose starts to decline. We can see in Fig 5 of Volek’s study that from 60 minutes onwards, glucose starts to decline.
Finally
It is well worth wearing the CKM and doing tests as you get to learn about what goes on in your body. I’m not finished with testing though.
In my next 14 days I’ll be looking at how I respond to a more strict training regime where every day is identical and I’ll have multiple training sessions per day (fasted in the morning, no caffeine, cycling in the afternoon) during the week and longer sessions during the weekend (+/- 5 hour ride sessions).
Subscribe to get notified!
– – – – – – – T H E – E N D – – – – – – –

Leave a comment