Throughout all my investigations on the ins and outs of cholesterol, energy metabolism, diseases such as T2 diabetes, cancer, Alzheimer’s, ageing etc.. I learned a lot about the environment of which the circulating lipids can be seen as a proxy for it.
In the low carb community, as people get leaner there is a tendency for their LDL cholesterol (LDL-C) to rise over time. Naturally there is a concern because we are all very familiar with the message of increased risk for heart disease, atherosclerosis specifically.
What I want to do with this article is convince you of the possibility that not all high levels of LDL-C are equally bad.
Let’s assume for a minute that it does exist, a situation in which high LDL-C is healthy, except that situation is rarely seen. You have 10 of these people. Now you mix them in with a group of 990 people who have high LDL-C but these 990 people have a situation in which their high LDL-C is a proxy for high risk of atherosclerosis. Now you run a study on them, not knowing about these 2 different situations. You will compare this group against another group of 1000 people with low LDL-C and you follow them up for a very long and see which group has the most heart attacks. The group with high LDL-C has more heart attacks so naturally your conclusion is that high LDL-C is indicative of a higher risk. On average that is indeed true. The problem is that this is averaged out.
Those 10 people are swamped by the 990 and will not be noticed. This will lead research to think that all high LDL-C is bad.
What I will do now is first of all assume that there is such a split where high LDL-C is a proxy for ill health and where it is not a problem. I will call one group pathological LDL-C (patLDL) and the other group physiological LDL-C (phyLDL). This is analogous to pathological insulin resistance and physiological insulin resistance.
Quite a number of people have looked into this so I’m leaning heavily on their insights and will be mixing in my own. I hope to contribute in this topic of “high LDL-C always being bad” by making a side by side comparison.
For the record: this is analysis done for myself. I am just sharing this information with you and it is completely up to yourself to first of all validate what I’m saying is correct and it is your own responsibility for the actions you will take or not. In no way am I advising what you should do.
That said, lets look at patLDL first and then see if we can come up with research that shows there is indeed a phyLDL profile and check if the risk factors of patLDL are also present under phyLDL. If they are present, then it would be fair to conclude phyLDL is not really a thing isn’t it?
patLDL
First of all what are the official risk factors according to the NHS from the UK? I’ve highlighted the ones which are lifestyle dependent, where you can take action to change them.
- increasing age
- smoking
- an unhealthy, high-fat diet
- lack of exercise
- being overweight or obese
- regularly drinking excessive amounts of alcohol
- other conditions, including high blood pressure, high cholesterol and diabetes
- a family history of atherosclerosis and CVD
- being of south Asian, African or African-Caribbean descent
https://www.nhs.uk/conditions/atherosclerosis/
In the US, their NIH department of National Heart, Blood and Lung institute is a bit more elaborate. I’ve highlighted a number of interesting focus points for later on.
Major Risk Factors
- Unhealthy blood cholesterol levels. This includes high LDL cholesterol and low HDL cholesterol.
- High blood pressure. At or above 140/90 mmHg over time. If you have diabetes or chronic kidney disease, high blood pressure is defined as 130/80 mmHg or higher.
- Smoking. Smoking can damage and tighten blood vessels, raise cholesterol levels, and raise blood pressure. Smoking also doesn’t allow enough oxygen to reach the body’s tissues.
- Insulin resistance. Insulin resistance may lead to diabetes.
- Diabetes. The body’s blood sugar level is too high because the body doesn’t make enough insulin or doesn’t use its insulin properly.
- Overweight or obesity.
- Lack of physical activity. A lack of physical activity can worsen other risk factors for atherosclerosis, such as unhealthy blood cholesterol levels, high blood pressure, diabetes, and overweight and obesity.
- Unhealthy diet. Foods that are high in saturated and trans fats, cholesterol, sodium (salt), and sugar can worsen other atherosclerosis risk factors.
- Older age.
- Family history of early heart disease.
“Studies show that an increasing number of children and youth are at risk for atherosclerosis. This is due to a number of causes, including rising childhood obesity rates.“
Emerging Risk Factors
- High levels of a protein called C-reactive protein (CRP) in the blood may raise the risk for atherosclerosis and heart attack. High levels of CRP are a sign of inflammation in the body.
- Inflammation is the body’s response to injury or infection. Damage to the arteries’ inner walls seems to trigger inflammation and help plaque grow.
- People who have low CRP levels may develop atherosclerosis at a slower rate than people who have high CRP levels. Research is under way to find out whether reducing inflammation and lowering CRP levels also can reduce the risk for atherosclerosis.
- High levels of triglycerides (tri-GLIH-seh-rides) in the blood also may raise the risk for atherosclerosis, especially in women. Triglycerides are a type of fat.
- Studies are under way to find out whether genetics may play a role in atherosclerosis risk.
Other Factors
- Sleep apnea. Sleep apnea is a disorder that causes one or more pauses in breathing or shallow breaths while you sleep. Untreated sleep apnea can raise your risk for high blood pressure, diabetes, and even a heart attack or stroke.
- Stress. Research shows that the most commonly reported “trigger” for a heart attack is an emotionally upsetting event, especially one involving anger.
- Alcohol. Heavy drinking can damage the heart muscle and worsen other risk factors for atherosclerosis.
https://www.nhlbi.nih.gov/health-topics/atherosclerosis
These are all well established risk factors. If the list is a bit overwhelming and hard to grasp at once, let me break down these factors in the light of the lipid profile that shows increased risk.
Lipid profile:
- High LDL-C
- Low HDL-C
- High Triglycerides
Along with:
- High blood pressure
- Overweight/obesity
- T2 diabetes
- Raised inflammation
- High levels of CRP
- Insulin resistance
- Smoking
- Chronic Kidney Disease
Apart from smoking, all the other risk markers are all linked to insulin resistance.
- High blood pressure: https://pubmed.ncbi.nlm.nih.gov/7512468/
- Obesity: https://www.ncbi.nlm.nih.gov/pmc/articles/PMC380258/
- T2 diabetes: https://www.ncbi.nlm.nih.gov/pmc/articles/PMC3314346/
- Inflammation: https://www.ncbi.nlm.nih.gov/pmc/articles/PMC2246086/
- High CRP (which is an inflammatin marker: https://bmjopensem.bmj.com/content/3/1/e000236
- Chronic Kidney Disease: https://pubmed.ncbi.nlm.nih.gov/27707707/
Is it feasible that the lipid profile reflects insulin resistance?
The 3 major components of the dyslipidemia of insulin resistance are increased triglyceride levels, decreased high-density lipoprotein (HDL) cholesterol, and changes in the composition of low-density lipoprotein (LDL) cholesterol.
source: “Insulin resistance and lipid metabolism” https://pubmed.ncbi.nlm.nih.gov/10418856/
The LDL-C/HDL-C ratio in men and LDL-C/HDL-C, TG/HDL-C, and non-HDL-C/HDL-C ratios in women might be clinically significant predictors of IR in healthy Korean adults.
source: “What is the most appropriate lipid profile ratio predictor for insulin resistance in each sex? A cross-sectional study in Korean populations (The Fifth Korea National Health and Nutrition Examination Survey)” https://dmsjournal.biomedcentral.com/articles/10.1186/s13098-015-0051-2
What you see in these ratios is that the risk goes up as LDL or triglycerides goes up and the risk goes down as HDL-C goes up.
Insulin resistance, as manifested by a high triglyceride/HDL-c ratio, was associated with adverse cardiovascular outcomes more than other lipid metrics, including LDL-c, which had little concordance.
source: “Study of the Use of Lipid Panels as a Marker of Insulin Resistance to Determine Cardiovascular Risk” https://www.ncbi.nlm.nih.gov/pmc/articles/PMC4625988/
We see here the same ratio back and they even found no use in looking at LDL-C.
It seems to support the case to state that the lipid profile is pathological if your LDL-C goes up, HDL-C goes down and triglycerides go up. Perhaps even more important is that your lipids are evolving into this scenario over time so that you see which way you are going.
If you keep all conditions the same, smoking or not and your activity level then only food is left to have a serious impact on your lipid profile.
phyLDL
You may or may not know this but food can have a very dramatic impact on your lipids.
Having read the previous section where you saw almost all risk factors, including the lipid profile, linked to insulin resistance…
Would you consider to be at risk for CVD under the following conditions?:
- Lean (instead of obese)
- Active (instead of sedentary)
- Insulin sensitive (instead of insulin resistant)
- Low hsCRP (instead of high hsCRP)
- Low blood pressure (instead of high blood pressure)
- No chronic kidney disease (instead of having it)
- Not smoking (instead of smoking)
- High HDL-C (instead of low HDL-C)
- Low triglycerides (instead of high triglycerides)
- Yet high LDL-C
So out of all the risk factors, only your LDL-C matches while we have seen that the ratios are better predictors, not the isolated LDL-C value. And the LDL-C value was seen in the light of insulin resistance.
Would you truly believe you are at risk?
Such a profile does exist among humans but is rarely seen. Rarely because it takes a specific diet and lean humans. Could they be the 10 people in our group of 1000 where 990 really are at an increased risk?
But before we look at the diet, lets have a look at endurance athletes who we can view as an example of fit and healthy individuals. I want to see what is happening to their lipid profile and then see how the lipid profile of the diet matches with it.
Endurance Athletes
Let’s just list up a few studies and see what they have to say about the lipid profile.
- Low LDL-C/HDL-C and low triglycerides
“Long distance runners and body-builders exhibit elevated plasma levels of lipoprotein(a)” https://pubmed.ncbi.nlm.nih.gov/8187216/
2. Higher HDL-C and lower TC/HDL-C (TC = total cholesterol)
“Elevated high-density lipoprotein cholesterol levels in older endurance athletes” https://pubmed.ncbi.nlm.nih.gov/6465022/
3. Higher HDL-C and lower triglycerides
“High density lipoprotein metabolism in endurance athletes and sedentary men” https://pubmed.ncbi.nlm.nih.gov/2060090/
4. Higher HDL-C and lower triglycerides. This study looked at the clearance rate of triglycerides and found a strong negative relation with fasting triglycerides and a strong positive relation with HDL-C levels. So the lower your triglycerides and the higher your HDL-C, the faster you are able to clear triglycerides from the circulation.
“Elevated high-density lipoprotein cholesterol in endurance athletes is related to enhanced plasma triglyceride clearance” https://pubmed.ncbi.nlm.nih.gov/3374323/
5. Increase in HDL-C and lower triglycerides, if triglycerides started out high.
“The influence of exercise on the concentrations of triglyceride and cholesterol in human plasma” https://pubmed.ncbi.nlm.nih.gov/6376133/
I think you get the picture by now. They all report increase in HDL-C and a reduction in triglycerides. Yet none of them report on LDL-C except for the last one saying there is hardly any change.
If LDL-C would be so important for health, then why don’t we see it noticeably reduced in endurance athletes?
We have a bit of a baseline now so let’s look at how diet could be matching with the changes that we see in endurance athletes.
Diet
People who go on a ketogenic diet which is high in dietary fat intake and very low in carbohydrate intake (to stimulate easier ketone production) often tend to do it for weight loss. As they get leaner they may experience a rise in LDL-C. The most lean subjects, who may have gotten onto the diet while they were already lean, see their levels go sky high. Often they hear from their doctor that they have never seen this before.
I collected a sample from such people’s self-reported figures to see the correlation with ApoE version but that is not important. The graph shows you averages of in total 52 people. You can ignore the 2/3 and 4/4 groups because they have only 4 and 3 samples.
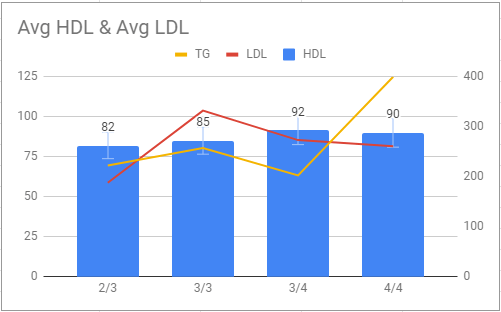
They have low triglycerides and very high HDL-C levels. The athletes usually have HDL-C levels of around 60 mg/dL from what I’ve seen in the papers.
Most of the people behind these numbers report an active lifestyle although that is not the case for all of them but they all have low body fat in common with athletes. They are generally health conscious and generally fit the phyLDL conditions.
Diet and Endurance
Just a trivia, how about mixing the diet in with endurance athletes? This study has been done and here are the results.

You see here that the HDL-C has gone up significantly higher. This has positively affected the triglyceride/HDL-C ratio. Triglycerides were already low in both groups. Also here we see a higher LDL-C in the low carb group.
“Paradox of hypercholesterolaemia in highly trained, keto-adapted athletes” https://pubmed.ncbi.nlm.nih.gov/30305928/
patLDL versus phyLDL
But back to the diet itself. Let’s review that list again. How does it compare to the pathological risk factors?
- Reduction in inflammation: https://pubmed.ncbi.nlm.nih.gov/18046594/
- Reverses T2D: https://www.ncbi.nlm.nih.gov/pmc/articles/PMC6104272/
- Improves Chronic Kidney Disease: https://www.ncbi.nlm.nih.gov/pmc/articles/PMC7071259/ (perhaps confounded by weight loss) https://pubmed.ncbi.nlm.nih.gov/23611549/
- Lowers blood pressure: https://www.ncbi.nlm.nih.gov/pmc/articles/PMC6695889/
- Reduction in hsCRP: https://www.ncbi.nlm.nih.gov/pmc/articles/PMC5928595/
Lipid profile:
- Very high LDL-C
- Very high HDL-C
- Low triglycerides
Taking everything into account, this profile is far from resembling that of the patLDL.
Finally
As you can see in this article, the profile of the lipids and risk factors associated with CVD do not fit with athletes nor with lean people on a ketogenic diet, nor with athletes on a ketogenic diet.
This comparison shows us that there is clearly a difference. There is indeed a case to create when elevated LDL-C is a bad sign but it should be seen in light with all the other factors. For the majority of people who are not on a ketogenic diet (the 990 people) you need to be worried. But for the small group of others who are on a ketogenic diet and fit the physiological high LDL-C, I’m not worried about CVD risk.
All the risk factors are not present and the lipid profile is different. LDL-C should not be looked at in isolation.
—- T H E – E N D —-

Leave a comment